Why a Single Picture Can’t Prove a Climate: Teaching Global Climatology Through Real Evidence
When elementary children look at a travel photograph of snow-covered pines, they almost always declare that the place has a polar climate. Finding an authentic climate zones workbook for kids that dismantles this visual snapshot trap is essential for genuine earth science literacy. A well-structured climate zones workbook for kids trains young observers to look past a single stormy morning or an isolated sunny afternoon, teaching them to interrogate long-term meteorological evidence—tracking monthly temperatures, graphing precipitation rhythms, and calculating seasonal ranges across decades.
Standard classroom printables often reduce planetary climatology to an oversimplified three-stripe diagram: freezing poles, mild middles, and a scorching equator. Students memorize these bands as static rules, yet they remain completely unable to explain why high equatorial peaks in the Andes are capped with permafrost, why inland Canadian cities endure far more brutal winters than coastal ports at the identical latitude, or why a cold desert like the Gobi can freeze while remaining bone-dry.

In Climate Zones Around the World: Read the Clues. Explain the Climate (a 28-page printable workbook designed for ages 7–10 by TinyJoy Studio), children do not merely memorize vocabulary—they work as climate detectives. Using three foundational inquiry steps—Look, Compare, and Explain—students evaluate real meteorological metrics, test physical landscape models, and discover that while a picture suggests an idea, only multi-year data proves a climate.

Weather or Climate: The First Critical Boundary
The fundamental conceptual leap in atmospheric science begins with time scales. On page 3, students confront the distinction between daily weather and long-term climate:
- Weather: What the atmosphere is doing right now or over a short window—such as a rainy Tuesday morning or an unseasonably windy afternoon.
- Climate: The usual, recurring pattern of weather recorded over thirty or more years.
Children evaluate real scenario prompts: Does a freezing winter day prove a place has a polar climate? Does three consecutive days of torrential rain mean a region is wet all year round? Learners realize that an average describes a central tendency, not every single day on the calendar. A rare chilly snap can strike a tropical coast, and an intense summer heatwave can sweep an inland continental basin without altering the underlying climate classification.
Developing this habit of interrogating everyday assumptions mirrors the analytical mindset we cultivate across our curiosity books for kids in the Curious 25 series, where curious minds investigate everyday phenomena through bite-sized, critical scientific questions.

The Five Climate Groups: Data over Appearance
Rather than memorizing arbitrary labels, students are introduced to a simplified five-group classification system inspired by the Köppen climate framework:
- Tropical (TR): Warm throughout the year, where rain may pour in every season or alternate between intense wet and dry monsoon pulses.
- Dry (DR): Regions defined by severe moisture deficits rather than heat alone, encompassing baking sand deserts like the Sahara and freezing gravel wastes like the winter Gobi.
- Temperate (TE): Moderate regions featuring mild winters, though seasonal rain can vary from dry Mediterranean summers to evenly spread coastal showers.
- Continental (CO): Marked by dramatic seasonal swings—bitterly cold winters plunging below freezing alongside warm summers.
- Polar (PO): Environments where even the warmest month of the year fails to average above 10°C (50°F), supporting dwarf tundra shrubs or permanent ice caps.
On pages 5 and 6, students learn to translate numerical climate tables into visual bar graphs, completing missing temperature bars and identifying the wettest months. They discover that a monthly rainfall value of 20 mm (0.8 in) is not a count of rainy days, nor does it equal zero moisture.
Understanding how moisture availability governs biological growth links atmospheric science directly to plant ecology. Just as living flora depend on continuous fluid circulation and precise germination temperatures—mechanisms explored in detail in our Plant Life Cycle Workbook—the seasonal pairing of heat and rain dictates whether a landscape flourishes as a dense rainforest or adapts as a dormant desert scrub.

The Physical Controls: Latitude, Oceans, and Mountains
Elementary geography often treats distance from the equator as the sole controller of temperature. Climate Zones Around the World systematically investigates the other physical forces shaping local environments:
- The Maritime Moderating Effect: On page 15, students compare Vancouver and Winnipeg—two Canadian cities situated at nearly identical northern latitudes. Children compare long-term meteorological data: coastal Vancouver experiences a mild January average of 4°C (39°F), while landlocked Winnipeg plunges to -16°C (3°F). Students calculate the seasonal temperature spread, realizing that ocean water absorbs and releases heat slowly, buffering coastal coastlines against extreme swings.
- Elevation Gradients: On page 14, children examine an altitudinal mountain transect rising from 500 meters to 2,500 meters. Guided by physical clues, they distribute temperatures from 24°C down to 12°C, proving that higher land is consistently cooler and that mountains can harbor cold climates even near the equator.
- The Rain Shadow Effect: On page 16, students trace how moist ocean air is forced upward over a coastal ridge. As the air rises and cools, clouds drop their rain along the windward slope, leaving dry, descending air to desiccate the leeward interior basin.
Connecting physical landscape divides, maritime passages, and regional climates mirrors the hands-on mapping approach of TinyJoy Studio’s broader geographic curriculum. If your family thrives on hands-on cartography, regional visa tracking, and physical geography portfolios, exploring how we approach project-based learning in homeschooling through our World Explorer series will give you an inspiring framework for integrating continental biomes into your home study.

The Evidence Auditor: Testing Claims and Planning Spaces
What sets this workbook apart from routine school sheets is its relentless focus on scientific epistemology and claim evaluation:
- Is That Enough Evidence? On page 20, students audit real-world claims. Given a single photograph of a house surrounded by winter snow, children evaluate the claim: «This place has a polar climate». Learners mark it as needing more information, noting that continental zones experience heavy winter snow yet boast warm summer growing seasons.
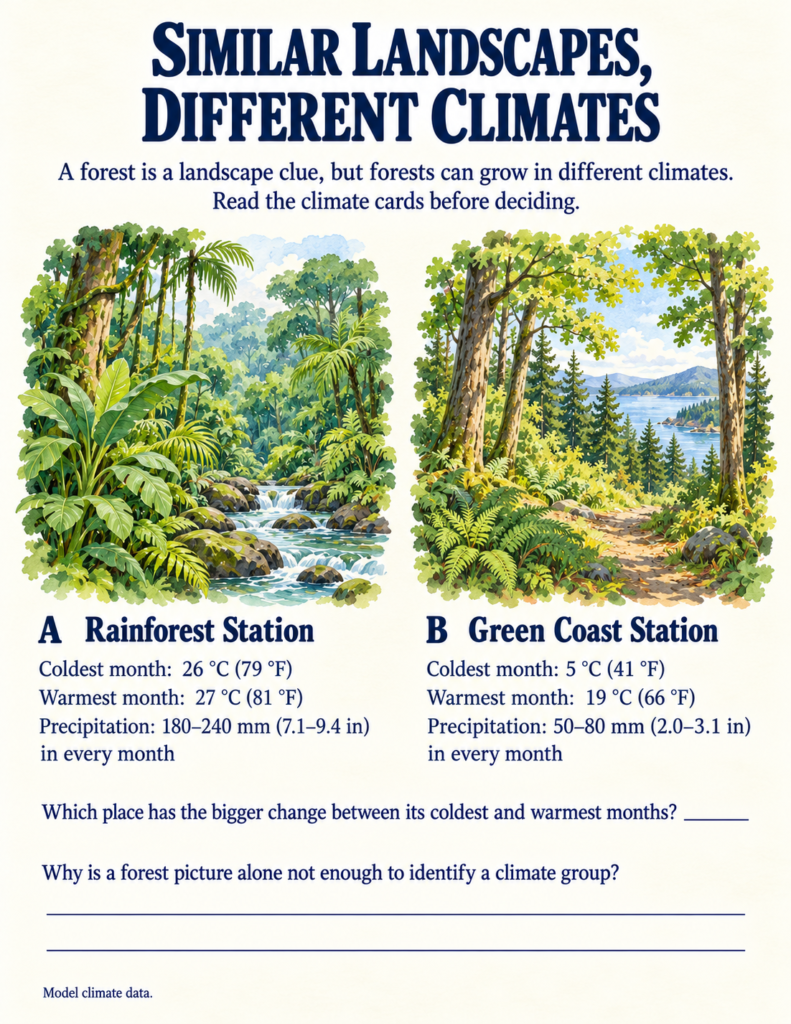
- Same Landscape, Different Climate: On page 21, students compare lush green forest illustrations from a tropical rainforest station and a temperate coastal station. The visual scenes look nearly identical, but the climate cards reveal that the temperate forest experiences a dramatic 14°C seasonal shift, while the tropical station holds steady at 26–27°C year-round.
- Fix the Climate Guide: On page 23, children edit an explorer’s flawed notebook, repairing widespread myths such as «all deserts are hot throughout the year» and «a snowy day proves a polar climate».
Connecting physical climate constraints to human infrastructure bridges earth science directly with historical settlements. Throughout human history, civilizations adapted their architecture, seasonal calendars, and town layouts to survive local climate realities—from building insulated northern shelters to engineering sun-shaded colonnades. This inquiry into how human societies adapt to their physical environment reflects the evidence-based approach in our interactive history curriculum for elementary learners, where students evaluate historical primary sources and material ruins rather than memorizing disconnected dates.
Practical Integration for Home and Classroom
Because Climate Zones Around the World contains self-contained model data cards, visual landscapes, an embedded 7-Day Weather Watch tracker, and complete answer keys, it fits effortlessly into various educational routines:
- Homeschool Physical Geography Unit: Work through two pages daily across a focused three-week block, combining book data with real backyard thermometer readings.
- Co-op Science Stations: Set up laminated copies of the «Climate Detective» mystery cards (page 19) and «Plan for the Climate» design challenges (page 22) for collaborative group problem-solving.
- The 7-Day Weather Watch Capstone: Have students complete the optional outdoor observation log (pages 29–30), recording temperature, sky conditions, and wind daily, before answering the pivotal reflection question: Does one week prove the climate of your area?
If you are looking for an educational printable that trades simplistic climate coloring stripes for authentic meteorological data, atmospheric modeling, and evidence-based geographic reasoning, Climate Zones Around the World equips young naturalists with the tools to decode the global atmosphere with scientific clarity.